
TL;DR
- Stocks have been the best long-term asset class, and low-cost index ETFs capture almost the full market return, while most active funds fall behind.
- In my 30-year model, an average earner saving €556 a month adds about €1,440 a month to her state pension with ETFs alone, against €851 with private pension insurance and €566 with a savings account.
- Company pensions trail independent investing, even with a 50% employer subsidy.
- The best result comes from €150 a month in the Altersvorsorgedepot, for the full allowance, and the rest in ETFs: about €1,500 a month.
- Investing on your own takes discipline: there are no guarantees, and you manage the withdrawals yourself.
Every pension product in the previous parts of this guide (company pensions, private pension insurance and the Altersvorsorgedepot) invests your money in the financial markets. Each one adds something on top (subsidies, tax breaks, guarantees, employer contributions) and takes something away (fees, restrictions, taxes at payout). To judge whether that trade-off is worth it, we need a benchmark: what would happen if you simply invested the same money yourself?
The best asset class for building wealth
If the goal is to build wealth over decades, stocks have historically been the clear winner. Over almost a century, they’ve outperformed bonds, gold and cash by a wide margin:
| Asset class (US, 1928–2025) | Average annual return | $100 invested in 1928 |
|---|---|---|
| Stocks (S&P 500, incl. dividends) | 10.0% | ~$1,158,000 |
| Corporate bonds | 6.6% | ~$54,000 |
| Gold | 5.6% | ~$21,000 |
| Government bonds (10-year) | 4.5% | ~$7,800 |
| Cash (3-month T-bills) | 3.4% | ~$2,600 |
Source: Damodaran, NYU Stern. Nominal returns in US dollars.
Gold shows the difference well. An ounce bought in 1928 for $20.67 was worth about $4,350 at the end of 2025. That sounds impressive until you compare it with stocks. Gold produces nothing, while companies earn profits and pay out dividends, which, reinvested, compound year after year.
The US was the most successful stock market of the 20th century, so its figures flatter stocks somewhat. Global stock markets have delivered lower, but broadly similar, long-term returns.
The rare case where the cheapest option is also the best
Usually, if you want to get better results you need to pay more. Investing in stocks is a strange and happy anomaly.
Whoever manages your money, whether a fund manager, an insurance company running a private pension plan, the provider of your company pension, or a robo-advisor, invests it in the same stock and bond markets you can access yourself. They have no special access to returns you can’t get. What they can do is try to pick better stocks or better moments. And the evidence shows that this almost never works.
S&P’s SPIVA report regularly looks at the performance of actively managed funds over various periods. The results are quite overwhelming: most funds, typically over 90%, underperform the market over a 20-year period:
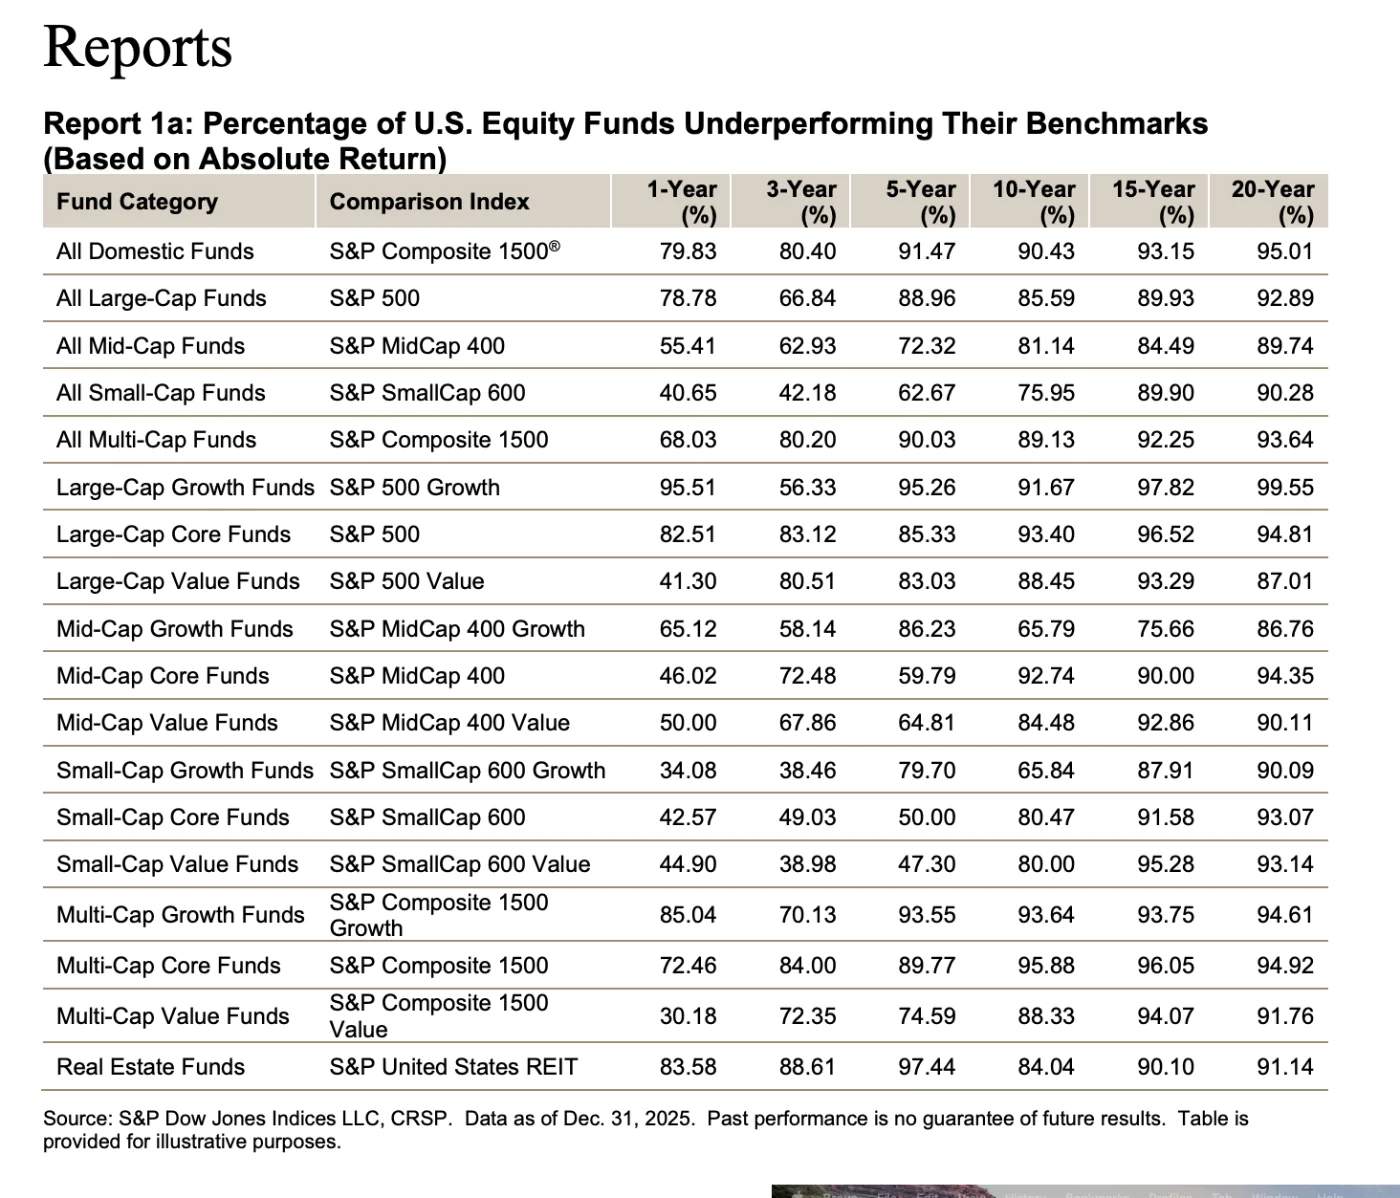
And the few that do beat the market rarely keep it up. Of the large-cap funds in the top half in 2021, fewer stayed there in every year until 2025 than you’d expect from pure chance. S&P’s own conclusion is that outperformance “tends to be the result of luck rather than genuine skill.”
So the question is: if none of them can reliably do better with your money than a simple ETF, why pay their fees? Those fees are typically 1–2% a year for actively managed funds and often more for insurance-based products. Robo-advisors usually invest in the same index ETFs you could buy yourself, and add their own fee on top.
Passive investing takes the opposite approach: it doesn’t try to beat the market, it buys the whole market. An ETF (exchange-traded fund) that tracks a broad index, such as the MSCI World with around 1,300 companies from 23 developed countries, gives you a small share of every company in the index with a single purchase. The index adjusts its weights automatically: growing companies get a bigger share, and shrinking ones drop out. No decisions, no stock picking, and almost no costs. A broad equity ETF typically costs 0.1–0.2% a year.
Over 30 years, this difference in cost adds up. Take €500 a month invested at a gross return of 7% a year:
| Annual costs | Value after 30 years | Share of the gross result you keep | |
|---|---|---|---|
| Before costs | 0% | €588,000 | 100% |
| Passive ETF | 0.1% | €577,000 | 98% |
| Actively managed fund | 1.5% | €447,000 | 76% |
That is, assuming the active fund even matches the market before its fees, which, as SPIVA shows, most don’t.
So the simplest option, one or two broad ETFs bought regularly and held, is also the one that has delivered the best results. With a low-cost ETF, what you earn is almost exactly what the market earns.
Time is what makes it work
The other side of that coin is volatility. In any single year, the stock market can rise by 30% or fall by 40%, and nobody can predict which. Over a short horizon, the range of possible outcomes is enormous: an investment can do very well or go badly wrong, and it’s largely a matter of luck which one you get.
Your best (and only) defence against this volatility is time. The longer you stay invested, the closer your average annual return moves towards the long-term average, as the chart below shows:
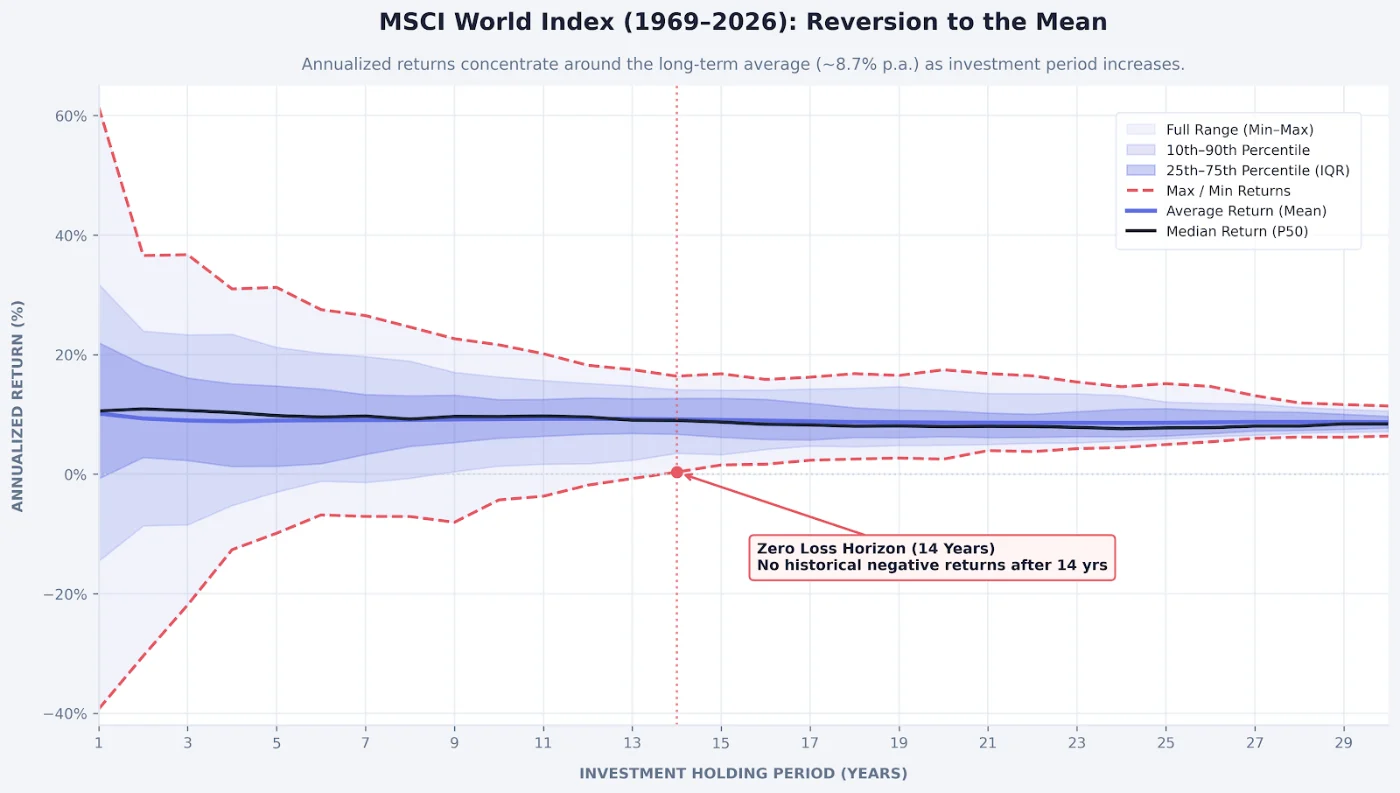
Over 1 year, returns have ranged from deep losses to spectacular gains. Over 20 or 30 years, they fall into a narrow band around the long-term average. That’s what makes long-term investing so different from short-term speculation: the longer the horizon, the more certainty you have, and the more reliably you can plan with it. Since retirement savings are by nature long-term money, this works in your favour.
Time also drives compounding: returns earn returns of their own. At 7% a year, money roughly doubles every 10 years, so over 30 years, €10,000 grows to about €76,000. Each doubling takes about the same time, but the later ones add far more in euros.
What doesn’t work is trying to outsmart the market by jumping in and out. The best and worst days on the stock market tend to come close together, often within the same few weeks. According to J.P. Morgan, $10,000 invested in the S&P 500 from 2003 to 2022 grew to about $64,800. An investor who missed just the 10 best days, about 0.2% of all trading days, ended up with about $29,700. What matters is time in the market, not timing the market.
Taxes
In Germany, investment income is taxed at a flat 25% (Abgeltungsteuer) plus the solidarity surcharge: 26.375% in total, plus church tax if applicable.
- Annual tax-free allowance: the first €1,000 of investment income each year is tax-free (Sparerpauschbetrag), or €2,000 for married couples (Unfortunately, this allowance cannot be rolled over to future years - if not used, it's just gone).
- Partial exemption for equity ETFs: 30% of gains are tax-free (Teilfreistellung), so the effective rate on gains is 18.46%.
- Annual advance tax on accumulating ETFs: a small notional amount is taxed each year (Vorabpauschale). It’s credited against your tax when you sell.
- When you pay: apart from that, tax is due only when you sell, so gains compound largely untaxed for decades.
- Which units are sold first: within one ETF, the oldest units are always sold first (FIFO), and they carry the most gain. Spreading your savings over several ETFs bought one after another, and selling the most recent one first, lowers the tax in the early years of retirement.
German brokers handle all of this automatically.
How it compares with the pension products
| Employer's pension | Private pension insurance | Altersvorsorgedepot | Independent ETF investing | |
|---|---|---|---|---|
| State or employer support | Tax- and social-security-free contributions, at least 15% from the employer | None | Allowances and tax deduction | None |
| Access to your money | Locked until retirement | Locked; cancelling early usually costs money | Locked until retirement (normally 65) | Any time |
| Typical costs | Varies widely, often high | Often high | Up to 1% (standard depot), no cap otherwise | Around 0.1–0.2% a year |
| Guarantees | Usually yes, at the cost of returns | Optional | Optional (guarantee products) | None |
| Tax at payout | Fully taxed as income, plus health insurance contributions | Partly taxed (Ertragsanteil or half the gain) | Subsidised part fully taxed | Flat tax on gains only |
| If you leave Germany | Depends on the scheme | Contract continues | See Part 6 | Unaffected; taxes follow your new residence |
| If you die | Depends on the scheme | Depends on the contract | Can pass to a spouse; otherwise subsidies may be reclaimed | Part of your estate |
As already mentioned and demonstrated in the previous parts, pension products’ strongest selling points are the tax benefits and incentives in either the accumulation phase or the payout phase: employer contributions, tax and social-security savings, state allowances, and preferential taxation on payouts.
On the other hand, independent investing’s strongest arguments are lower costs, full flexibility, and independence from your employer and your country of residence. The question is which of the two weighs more. The best way to answer that is to put numbers on it.
Putting numbers on it: one saver, eight strategies
I modelled what each strategy adds to retirement income for one realistic saver, under realistic assumptions.
The saver:
- Income: Our saver earns the German average salary, €51,944 gross a year in 2026, which is €33,362 net. She's single, has no children, is therefore in tax class I, and has statutory health insurance.
- Savings: puts aside 20% of her net income, €556 a month, from age 37 to 67, for a total of 30 years.
- State pension: without any savings, she can expect about €1,400 a month net (40 years at average salary).
- The test: in every strategy, she gives up the same €556 a month of take-home pay. What differs is where it goes, and what comes back in retirement.
The strategies:
- No investing: a savings account at 2%.
- ETFs only: a low-cost, broad ETF portfolio.
- Private pension insurance: a fund-based policy.
- Company pension + ETFs: the maximum salary conversion free of social contributions (€4,056 a year including the employer’s share), the rest in ETFs. Once with the legal minimum employer subsidy of 15%, once with a generous 50%.
- Altersvorsorgedepot + ETFs: €1,800 a year into the standard depot (the amount that earns the full allowance), the rest in ETFs.
- All three combined.
Main assumptions:
- Growth and inflation: salary, savings, the state pension, tax allowances and the Altersvorsorgedepot amounts all rise with inflation of 2% a year. For simplicity, all results are shown in today’s euros.
- Returns and costs:
- stocks earn 7% a year before costs; inflation is 2%;
- ETF costs are 0.1% a year;
- the Altersvorsorgedepot costs 0.5%;
- private insurance costs 1.7% a year, plus a one-off fee of 2.5% of all planned contributions;
- the company pension, an insurance product with an 80% guarantee, earns 2.75% a year after costs. It includes a one-off fee of 2.5% of all planned contributions.
- Payout:
- insurance products pay a lifelong annuity of €28 a month per €10,000, fixed in euros;
- ETF and depot savings are paid out through a payout plan that rises with inflation and runs until 95.
- Taxes and contributions: everything after income tax, capital gains tax and health insurance contributions. Company pension scenarios also include the smaller state pension caused by salary conversion.
Results: extra net income on top of the state pension, per month, in today’s euros:
| Scenario | How the ETF portfolio is paid out | At 67 | Capital left at 85 |
|---|---|---|---|
| No investing (savings account) | No ETFs | €566 | €67,869 |
| ETFs only | Payout plan to 95 | €1,442 | €183,950 |
| ETFs only | Cautious: 3.5% a year | €1,091 | €292,307 |
| Private pension insurance | No ETFs | €851 | €0 |
| Company pension (15% subsidy) + ETFs | Payout plan to 95 | €1,226 | €132,126 |
| Company pension (15% subsidy) + ETFs | Cautious: 3.5% a year | €974 | €209,954 |
| Company pension (50% subsidy) + ETFs | Payout plan to 95 | €1,334 | €144,310 |
| Company pension (50% subsidy) + ETFs | Cautious: 3.5% a year | €1,059 | €229,316 |
| Altersvorsorgedepot + ETFs | Payout plan to 95 | €1,503 | €198,339 |
| Altersvorsorgedepot + ETFs | Cautious: 3.5% a year | €1,238 | €280,342 |
| Company pension (15%) + AVD + ETFs | Payout plan to 95 | €1,283 | €146,514 |
| Company pension (15%) + AVD + ETFs | Cautious: 3.5% a year | €1,116 | €197,990 |
| Company pension (50%) + AVD + ETFs | Payout plan to 95 | €1,390 | €158,699 |
| Company pension (50%) + AVD + ETFs | Cautious: 3.5% a year | €1,200 | €217,352 |
“Cautious” rows withdraw 3.5% of the ETF portfolio a year instead, which means less income but more capital left.
What the numbers show:
- Not investing costs her more than half the potential income. The savings account adds €566 a month. The same money in ETFs adds €1,442, about two and a half times as much. And, invested amounts keep growing during retirement - cash doesn't.
- Private pension insurance is the weakest investment option. It starts at €851 a month, about 40% less than ETFs only. Because the annuity is fixed in euros, its value falls to about €596 in today’s money by 85. And nothing is left for her heirs.
- The company pension doesn’t beat investing on her own, even with a 50% employer subsidy. Even though the subsidy nearly triples the money going in, four other factors eliminate the advantage completely:
- low returns under the guarantee;
- an annuity that pays less than a payout plan and loses value with inflation;
- full income tax plus health and care contributions in retirement;
- a smaller state pension.
- The best result combines a capped subsidised layer with independent investing. Paying €150 a month into the Altersvorsorgedepot (just enough for the full allowance) and investing everything else in ETFs comes out slightly ahead of ETFs only, by about €60 a month. The allowances make the first €1,800 a year worth subsidising. Beyond that, nothing more is added, and lower costs and full flexibility make independent investing the better place for the rest. In this strategy, about 70% of her capital at 67 is still invested independently.
- ETFs leave something behind. Under the payout plan, the ETF-based strategies still hold around €130,000–200,000 at 85, which can cover care costs or go to her heirs. With the cautious 3.5% rule, it’s about €200,000–290,000.
- A simple tax technique adds more early on. Splitting the portfolio over four ETFs lifts her income at 67 by about €50–150 a month, by moving part of the tax into later years.
To state the obvious, these figures depend on assumptions, especially the company pension’s return and the employer subsidy, so a better product or a more generous employer would narrow the gap. But even with a considerably better company pension product, returning 4.5% a year instead of 2.75%, the 50%-subsidy case still trails ETFs only (€1,399 vs €1,442 a month at 67). It's worth remembering that better returns will improve all results, but will increase the gap in favour of independent investing even more, since most products have a "profit participation mechanism", where the provider gets to keep some of those excess returns.
What independent investing doesn’t do for you
Still, independent investing comes with its own set of challenges:
- No guarantees. Your portfolio can lose substantial value, and you need to be able to sit through that without selling.
- No lifelong pension by default. You have to manage withdrawals yourself to make sure the money lasts. A cautious starting withdrawal rate of 3.5% of the portfolio value at retirement is a common rule of thumb for long retirements.
- Behaviour matters most. Fear in a crash, greed after a good year, and impatience in a flat one are the most common reasons investors earn less than the market they invest in. I wrote about how to prepare for this, and protect yourself from your own bad decisions, in You are the zombie and Panic, greed and the end of days.
To see what regular investing could add up to in your case, check out the investment calculator.
Sources
- Historical returns 1928–2025: Aswath Damodaran, NYU Stern
- SPIVA U.S. Scorecard, year-end 2025: S&P Dow Jones Indices
- Partial exemption for equity funds: § 20 InvStG
- Flat tax and annual allowance: §§ 20 and 32d EStG
- Investment calculator
This guide is general information, not personal financial advice. Please read the disclaimer.