
This blog post is a bit different than all previous ones: it's rather technical, and goes specifically into some of the recent changes I made in the Foundations App.
It's quite nerdy, and dives quite deeply into pretty technical stuff. I suspect it has a limited target audience, I just hope its size is bigger than 1 (the 1 being myself). Also worth mentioning: everything described below is true at the time of writing this. It's a fundamental change in the way I use projections for financial planning, and it's quite likely there will be some fixes and fine tuning in the future.
The Foundations App
Before going into what's new, a quick review of what I had so far. The Foundations App serves two purposes: it's designed to be my main tool when preparing a financial plan for a client, and it then makes this plan available to the client. The client can always access their plan, so that they can remind themselves of what is actually in it, make adjustments (salary bump, one time amounts they got etc.) and serve as a basis for any future discussions, once anything changes in their circumstances and there's a need to review and adjust the plan.
Deterministic vs. Probabilistic
Naturally, most plans' starting point is "today", or the day of preparing the plan, but most of the time horizon which is covered in the plan is in the future. And that's a challenge, because I'm trying to describe something that didn't happen yet. And that's a terrible, terrible idea.
It's tough to make predictions, especially about the future.
But it's the task I took upon myself, so I might as well do it as well as possible. So far, it's been based on a deterministic model. That's a fancy way of saying that, in such a projection, we assume a certain rate of return, and apply it year over year to the user's portfolio. If we plot this portfolio's development in a chart, it constantly goes up and to the right. And that never happens in real life.
Now, to be more specific, if the accumulation phase is long enough, say 20 years or longer, it's a reasonable way to project what will be the portfolio's value at the end of this phase. As long as the assumed rate of return is conservative enough, it's a reasonable estimate.
However, that's still the easy part. The problems start when:
- A projection for a shorter horizon is needed
- There's a need to account for sequence of returns risk, or in simple words: to stress-test the projection
Why?
Shorter horizons
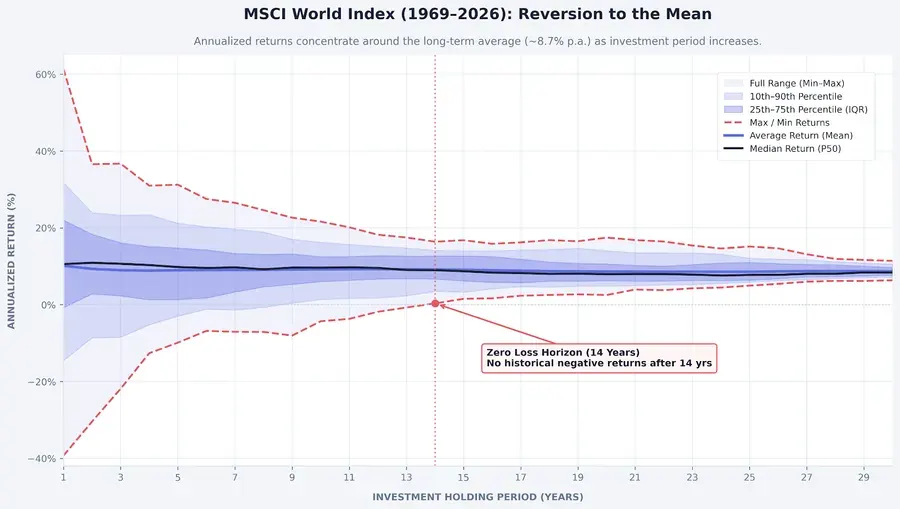
Stock market returns have a clear reversion to the mean (another fancy word). In simple terms, over a long-enough period, they get closer and closer to their long-term average. The variance is higher in the short-term, and over a long horizon we have more certainty. Periods of amazing returns will be evened-out by periods of weaker returns: crashes, recessions and all of the great things stock market investing has to offer every once in while. You can see it clearly in this chart:
When projecting for a shorter period, it's easy to say that the variance is higher, but by how much? what is the actual range of possible results?
Sequence of returns
Deterministic models are simplistic by nature. Reality is more complex and unpredictable. And one specific risk is critical for savers: sequence of returns. If you're 30 years away from retirement, and you're planning to invest regularly over that period, by making conservative assumptions with regards to the average annual rate of return, it's generally fine to project the portfolio's value at the time of retirement.
Sure, reality will look entirely different than that simplistic projection, but over time the two lines will converge (see reversion to the mean). As long as the two lines converge at the end, it doesn't matter how far apart they might be along the way:
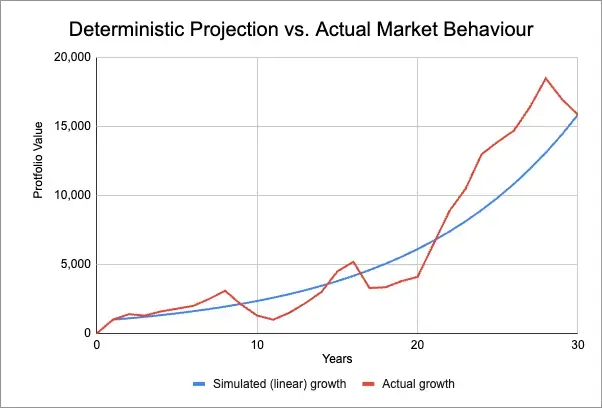
Specifically, it doesn't matter because, at least in theory, there are no external cashflows; the saver doesn't plan to take out any money during the accumulation phase. But then they retire, and they do plan to make withdrawals. More critically, they depend on these withdrawals - that's the very reason they invested all these years; to generate a big-enough portfolio so they can withdraw from it and generate an additional income source. But sequence of returns risk is the ultimate party pooper; when realised in its fullest form, it takes such a plan and might throw it out the window. Even if the plan itself is not totally ruined, the investors' peace of mind is gone, never to be seen again.
What exactly is sequence of returns risk? it's a scenario in which there are bad returns, year after year (sequence), early on¹ in the retirement phase. They bring the portfolio's value down so aggressively, that it cannot recover (since the investors also makes withdrawals at the same time).
¹ If an extended period of low or negative returns happens later in retirement, the plan is still relatively safe. It's the combination of bad things happening early that is lethal.
Let's look at an example, comparing two scenarios, one with strong early returns (A) and another with weak early returns (B). If you change the "Initial Annual Withdrawal" you'll see that the highest value that Scenario A can support is 47,500€ in the first year, whereas Scenario B can only support 25,000€. Any more than that, and in scenario B the portfolio is depleted and doesn't recover. That's a huge difference, and in retirement planning terms, it means scenario B only offers a maximal Safe Withdrawal Rate (SWR) of 2.5% - that's very low. Scenario A can cover 30 years of withdrawals even with an initial SWR of 4.75% - much higher than the famous 4%-rule.
Interestingly, without any withdrawals at all, they both end up having the exact same amount after 30 years. That means that for this 30 years horizon, they both have the same average annual returns, but it's the order in which those returns occur that makes the difference.
And that exactly the issue with a deterministic projection - it's blind to such scenarios. It doesn't mean it would fail, or that it's unrealistic - far from it, especially if the assumed rate is conservative (and I always, always stick to conservative assumptions). But it has its limitations. And exactly here is where a probabilistic model can offer significant benefits.
If predictions about the future are hard, why not try multiple futures?
In a deterministic projection, there's only one future. If it's a very optimistic projection, most realistic scenarios will be worse than the projection. Obviously, it'd be irresponsible to rely on such a projection. But the opposite is also true - if it's too conservative, it's very likely that reality will eventually be better than the plan. This might mean that an investor could have retired sooner, could have spent more money on things they love, or possibly even both. And the only reasonable, responsible strategy when using a deterministic model is to be conservative.
A probabilistic model approaches this task in an entirely different way: instead of choosing one number, we generate many, many, possibly futures. And the most widely-accepted method of doing that is using a Monte Carlo simulation. In simple words, we use historical data to generate multiple possible paths. In even simpler words: we take the historical returns of a specific index, throw them in a blender and see what comes out. And we repeat this thousands of times. The result is thousands of possible futures, but they're not just random numbers - they're actual historical figures, just rearranged.
Block Bootstrapping
There's another nuance to it: if we simply took the daily/monthly returns of a major index, say the MSCI world, and randomized the order in which they appear, we'd be neglecting to consider an important factor. Markets have momentum, positive or negative, and that plays an important part. Recessions wouldn't be recessions if we didn't see month after month of negative returns. The common way to account for that is Block Bootstrapping - returns are randomized, but we're not just taking monthly returns independently, we apply them as blocks of a pre-determined size (3 years, 5 years, etc.). This maintains the full effect of living through a period like the dot com bubble, the 2007-8 global financial crisis, or any other significant downturn in the markets. For example, the MSCI World index dropped almost 40% between May 2008 and February 2009, but if we didn't include this period as a single block in the randomized projections, and just included all months individually, in most randomized projections the full effect of this period would be "diluted", by mixing it with other average or even highly positive months, which would miss the purpose entirely.
How it's currently applied in the Foundations App?
Dataset selection
As a first step, I decided to base the projection on historical data of the MSCI World. It made sense to me because of several reasons:
- It's my go-to recommendation for a large portion of my clients, so it only makes sense to use it for planning purposes as well.
- Even for an investor who already has a portfolio comprised of other securities, the MSCI world is a good approximation of such a portfolio.
- Its data is relatively accessible, which makes implementation a bit easier.
I use the historical monthly performance of the index's total return, from 1969 and until present day (as time goes by, new monthly performance data is being appended to the data set).
Simulation process
Currently, I run 1,000 simulations, which is more than enough for a robust simulation. Those are then attached to the user's financial plan specific cashflows, based on this plan's parameters: retirement age, income, investment portfolio etc.
Results and interpretation
Once I have 1,000 complete projections, they are being scored with a "resiliency score". The basic idea is to penalize a plan more harshly, the deeper and longer a deficit is. If a plan's needs are fully covered, it gets a 100. If there's a small, insignificant deficit for a short while, a few points are deducted. If a deeper deficit is detected, the penalty will be bigger. And if a deficit is consistent, extending over several years in a row, the severity of the penalty will also be increased (assuming a small deficit which appears once is a mere inconvenience, but a lasting deficit, even if small, has a compounding effect).
Once all plans are scored, they are then ranked from best to worst. Obviously, multiple plans might get a perfect score for covering needs, so a secondary parameter used for ranking is the terminal value of the person's portfolio.
At the end of this process, 3 market scenarios are shown:
- P10 - A stress-test which assumes challenging market conditions over extended periods of time
- P50 - the median scenario. Technically, 50% of results are better than this scenario, and the other 50% are worse. But more importantly, most results are concentrated around this scenario.
- P90 - an almost-best-case scenario, based on very favorable market conditions.
One important note: not all plans will score a clean 100 in all 3 scenarios, nor do they need to. Getting a 100 score for your P10 scenario in your most ambitious plans means saving and accumulating very, very large amounts of money. You're very likely to sacrifice your present for the sake of an unknown future in a way which to me doesn't make sense.
On that same point, it's also worth mentioning, again, that predictions are hard.
What's the benefit in all that?
This new projection model is quite powerful, and I believe it provides deeper insights into a person's financial planning. But the key point is this: financial planning is not static, it's an on-going process. By running a simulation today, we're not setting in stone your financial future. We're setting a direction and clear guide lines for your plan, and we derive concrete actions from it. But in all likely scenarios, the most important thing is to revisit the plan every once in a while and adjust it, and your behavior, accordingly.
Interestingly, it is by creating a thousand possible future, that we can avoid being too conservative. Being extra cautios is generally good, but being too cautious has its costs. This new way of projecting multiple possible paths lets me stress-test a plan in a way which actually gives more confidence. The median results are based on real-life data. But also, the stress-test is real. And when bad times are here, being able to tell yourself that you prepared for this, you planned for this and your plan is robust, is one of the best defences you can build against yourself, and the poor choices you might make under pressure.